Royal Spoonbill
Platalea regia
ABR description
The following is extracted from the Annual Bird Report for the twelve months to June 2017.
Uncommon, breeding visitor
An irruptive species, sometimes appearing in small groups in wetlands across the region.
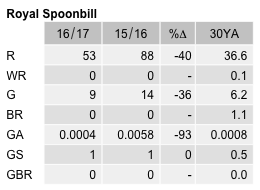
General: Declining trends for this species evident from 2013 continued this year: number of records down 40% to 53, the lowest since 2012; grid cells down 36% to 9; total number of birds down 54% to 59, lower than the 30, 20 and 10YAs; abundance (0.0042) and reporting rates (0.4) down 62% and 50% respectively; weeks recorded down 29% to 20. Max down from 4 to 3/15 Oct JWNR (MaM4), mean 1.1 (down from 1.5), median 1. Over 79% of the records were from JWNR/JW Woodland Walk of 1-3 birds reported by many observers over extended periods. No other locations had more than a single bird recorded, mainly on 1 or 2 days only. Winter and spring accounted for over 58% of records this year (33% last year). No breeding recorded.
GBS: only 1 record, 1/2wk Dec, Giralang Pond (KaD1). Recorded only 11 times in the GBS.
Abundance
Abundance is the average number of birds of that species per survey. Where the species was observed (presence recorded) but the number of birds seen was not recorded, this is treated as a count of zero.
Abundance by year
This chart shows the abundance of Royal Spoonbill between 1982 and 2017. 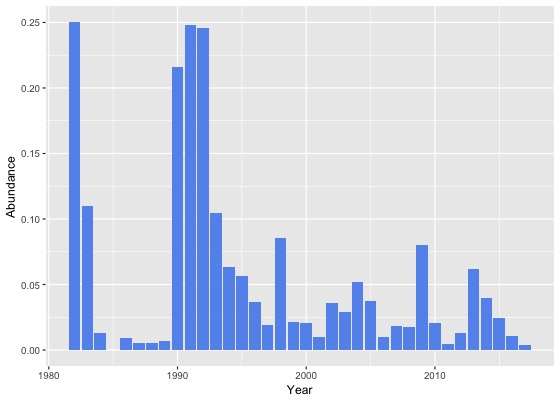
Abundance by month
This chart shows the monthly abundance of Royal Spoonbill. The blue lines show the abundance for the twelve months to June 2017 and the bars show the average abundance for the period 1982 to 2017. 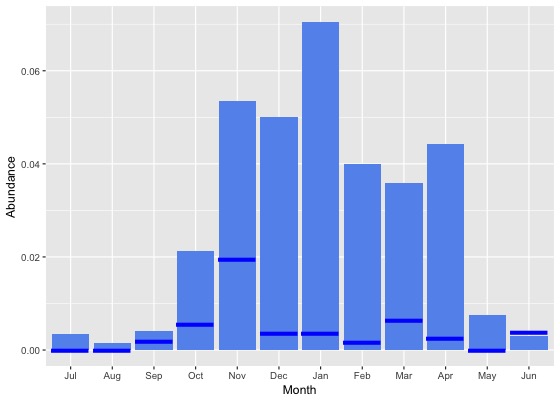
Abundance by season
This chart shows the seasonal abundance of Royal Spoonbill. The blue lines show the seasonal abundance for the twelve months to June 2017 and the bars show the average seasonal abundance for the period 1982 to 2017. 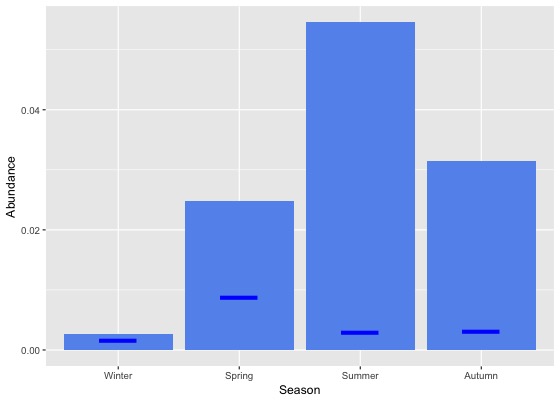
Abundance data
| Month | Season | ||||||||||||||||||
|---|---|---|---|---|---|---|---|---|---|---|---|---|---|---|---|---|---|---|---|
| Period | Jul | Aug | Sep | Oct | Nov | Dec | Jan | Feb | Mar | Apr | May | Jun | Winter | Spring | Summer | Autumn | All | ||
| All years | |||||||||||||||||||
| All | 0.0 | 0.0 | 0.0 | 0.0 | 0.1 | 0.1 | 0.1 | 0.0 | 0.0 | 0.0 | 0.0 | 0.0 | 0.0 | 0.0 | 0.1 | 0.0 | 0.0 | ||
| Previous years | |||||||||||||||||||
| All previous years | 0.0 | 0.0 | 0.0 | 0.0 | 0.1 | 0.1 | 0.1 | 0.0 | 0.0 | 0.1 | 0.0 | 0.0 | 0.0 | 0.0 | 0.1 | 0.0 | 0.0 | ||
| Previous 30 years | 0.0 | 0.0 | 0.0 | 0.0 | 0.1 | 0.1 | 0.1 | 0.0 | 0.0 | 0.1 | 0.0 | 0.0 | 0.0 | 0.0 | 0.1 | 0.0 | 0.0 | ||
| Previous 20 years | 0.0 | 0.0 | 0.0 | 0.0 | 0.1 | 0.1 | 0.1 | 0.0 | 0.0 | 0.0 | 0.0 | 0.0 | 0.0 | 0.0 | 0.1 | 0.0 | 0.0 | ||
| 10 year groups | |||||||||||||||||||
| [2007,2017) | 0.0 | 0.0 | 0.0 | 0.0 | 0.1 | 0.0 | 0.1 | 0.0 | 0.0 | 0.0 | 0.0 | 0.0 | 0.0 | 0.0 | 0.0 | 0.0 | 0.0 | ||
| [1997,2007) | 0.0 | 0.0 | 0.0 | 0.0 | 0.0 | 0.1 | 0.1 | 0.0 | 0.0 | 0.0 | 0.0 | 0.0 | 0.0 | 0.0 | 0.1 | 0.0 | 0.0 | ||
| [1987,1997) | 0.0 | 0.0 | 0.0 | 0.1 | 0.1 | 0.1 | 0.2 | 0.1 | 0.1 | 0.2 | 0.0 | 0.0 | 0.0 | 0.1 | 0.1 | 0.1 | 0.1 | ||
| 5 year groups | |||||||||||||||||||
| [2012,2017) | 0.0 | 0.0 | 0.0 | 0.0 | 0.0 | 0.0 | 0.1 | 0.0 | 0.0 | 0.1 | 0.0 | 0.0 | 0.0 | 0.0 | 0.0 | 0.0 | 0.0 | ||
| [2007,2012) | 0.0 | 0.0 | 0.0 | 0.0 | 0.1 | 0.0 | 0.1 | 0.0 | 0.0 | 0.0 | 0.0 | 0.0 | 0.0 | 0.0 | 0.0 | 0.0 | 0.0 | ||
| [2002,2007) | 0.0 | 0.0 | 0.0 | 0.0 | 0.0 | 0.1 | 0.2 | 0.0 | 0.0 | 0.0 | 0.0 | 0.0 | 0.0 | 0.0 | 0.1 | 0.0 | 0.0 | ||
| [1997,2002) | 0.0 | 0.0 | 0.0 | 0.0 | 0.0 | 0.1 | 0.1 | 0.1 | 0.0 | 0.0 | 0.0 | 0.0 | 0.0 | 0.0 | 0.1 | 0.0 | 0.0 | ||
| [1992,1997) | 0.0 | 0.0 | 0.0 | 0.1 | 0.1 | 0.1 | 0.2 | 0.2 | 0.2 | 0.1 | 0.0 | 0.0 | 0.0 | 0.1 | 0.2 | 0.1 | 0.1 | ||
| [1987,1992) | 0.0 | 0.0 | 0.0 | 0.0 | 0.0 | 0.1 | 0.1 | 0.1 | 0.0 | 0.2 | 0.0 | 0.0 | 0.0 | 0.0 | 0.1 | 0.1 | 0.1 | ||
| Year | |||||||||||||||||||
| 2017 | 0.0 | 0.0 | 0.0 | 0.0 | 0.0 | 0.0 | 0.0 | 0.0 | 0.0 | 0.0 | 0.0 | 0.0 | 0.0 | 0.0 | 0.0 | 0.0 | 0.0 | ||
| 2016 | 0.0 | 0.0 | 0.0 | 0.0 | 0.0 | 0.0 | 0.0 | 0.0 | 0.0 | 0.0 | 0.0 | 0.0 | 0.0 | 0.0 | 0.0 | 0.0 | 0.0 | ||
| 2015 | 0.0 | 0.0 | 0.0 | 0.0 | 0.1 | 0.1 | 0.0 | 0.0 | 0.0 | 0.1 | 0.0 | 0.0 | 0.0 | 0.0 | 0.0 | 0.0 | 0.0 | ||
| 2014 | 0.0 | 0.0 | 0.0 | 0.0 | 0.0 | 0.0 | 0.1 | 0.0 | 0.1 | 0.1 | 0.0 | 0.0 | 0.0 | 0.0 | 0.1 | 0.1 | 0.0 | ||
| 2013 | 0.0 | 0.0 | 0.0 | 0.0 | 0.0 | 0.1 | 0.2 | 0.0 | 0.1 | 0.2 | 0.0 | 0.0 | 0.0 | 0.0 | 0.1 | 0.1 | 0.1 | ||
| 2012 | 0.0 | 0.0 | 0.0 | 0.0 | 0.0 | 0.0 | 0.0 | 0.1 | 0.0 | 0.0 | 0.0 | 0.0 | 0.0 | 0.0 | 0.0 | 0.0 | 0.0 | ||
| 2011 | 0.0 | 0.0 | 0.0 | 0.0 | 0.0 | 0.0 | 0.0 | 0.0 | 0.0 | 0.0 | 0.0 | 0.0 | 0.0 | 0.0 | 0.0 | 0.0 | 0.0 | ||
| 2010 | 0.0 | 0.0 | 0.0 | 0.0 | 0.1 | 0.0 | 0.0 | 0.0 | 0.0 | 0.0 | 0.0 | 0.0 | 0.0 | 0.0 | 0.0 | 0.0 | 0.0 | ||
| 2009 | 0.0 | 0.0 | 0.0 | 0.0 | 0.4 | 0.1 | 0.4 | 0.1 | 0.0 | 0.0 | 0.0 | 0.0 | 0.0 | 0.1 | 0.2 | 0.0 | 0.1 | ||
| 2008 | 0.0 | 0.0 | 0.0 | 0.0 | 0.1 | 0.0 | 0.0 | 0.0 | 0.0 | 0.0 | 0.0 | 0.0 | 0.0 | 0.0 | 0.0 | 0.0 | 0.0 | ||
| 2007 | 0.0 | 0.0 | 0.0 | 0.0 | 0.1 | 0.0 | 0.0 | 0.0 | 0.0 | 0.0 | 0.0 | 0.0 | 0.0 | 0.0 | 0.0 | 0.0 | 0.0 | ||
| 2006 | 0.0 | 0.0 | 0.0 | 0.0 | 0.0 | 0.0 | 0.0 | 0.1 | 0.0 | 0.0 | 0.0 | 0.0 | 0.0 | 0.0 | 0.0 | 0.0 | 0.0 | ||
| 2005 | 0.0 | 0.0 | 0.0 | 0.0 | 0.0 | 0.1 | 0.4 | 0.0 | 0.0 | 0.0 | 0.0 | 0.0 | 0.0 | 0.0 | 0.2 | 0.0 | 0.0 | ||
| 2004 | 0.0 | 0.0 | 0.0 | 0.0 | 0.0 | 0.1 | 0.3 | 0.1 | 0.1 | 0.0 | 0.0 | 0.0 | 0.0 | 0.0 | 0.2 | 0.0 | 0.1 | ||
| 2003 | 0.0 | 0.0 | 0.0 | 0.0 | 0.2 | 0.1 | 0.0 | 0.0 | 0.0 | 0.0 | 0.0 | 0.0 | 0.0 | 0.1 | 0.0 | 0.0 | 0.0 | ||
| 2002 | 0.0 | 0.0 | 0.0 | 0.0 | 0.0 | 0.1 | 0.2 | 0.0 | 0.0 | 0.0 | 0.0 | 0.0 | 0.0 | 0.0 | 0.1 | 0.0 | 0.0 | ||
| 2001 | 0.0 | 0.0 | 0.0 | 0.0 | 0.0 | 0.0 | 0.0 | 0.1 | 0.0 | 0.0 | 0.0 | 0.0 | 0.0 | 0.0 | 0.0 | 0.0 | 0.0 | ||
| 2000 | 0.0 | 0.0 | 0.0 | 0.0 | 0.0 | 0.0 | 0.0 | 0.1 | 0.1 | 0.0 | 0.0 | 0.0 | 0.0 | 0.0 | 0.0 | 0.0 | 0.0 | ||
| 1999 | 0.0 | 0.0 | 0.0 | 0.0 | 0.0 | 0.1 | 0.1 | 0.0 | 0.1 | 0.0 | 0.0 | 0.0 | 0.0 | 0.0 | 0.1 | 0.0 | 0.0 | ||
| 1998 | 0.0 | 0.0 | 0.0 | 0.1 | 0.2 | 0.3 | 0.1 | 0.1 | 0.0 | 0.1 | 0.0 | 0.0 | 0.0 | 0.1 | 0.2 | 0.0 | 0.1 | ||
| 1997 | 0.0 | 0.0 | 0.0 | 0.0 | 0.0 | 0.0 | 0.0 | 0.1 | 0.0 | 0.0 | 0.0 | 0.0 | 0.0 | 0.0 | 0.0 | 0.0 | 0.0 | ||
| 1996 | 0.0 | 0.0 | 0.0 | 0.0 | 0.0 | 0.0 | 0.1 | 0.1 | 0.0 | 0.0 | 0.0 | 0.0 | 0.0 | 0.0 | 0.1 | 0.0 | 0.0 | ||
| 1995 | 0.0 | 0.0 | 0.0 | 0.0 | 0.0 | 0.2 | 0.1 | 0.1 | 0.3 | 0.0 | 0.0 | 0.0 | 0.0 | 0.0 | 0.1 | 0.1 | 0.1 | ||
| 1994 | 0.0 | 0.0 | 0.0 | 0.1 | 0.0 | 0.0 | 0.2 | 0.1 | 0.2 | 0.1 | 0.0 | 0.0 | 0.0 | 0.0 | 0.1 | 0.1 | 0.1 | ||
| 1993 | 0.0 | 0.0 | 0.0 | 0.3 | 0.4 | 0.0 | 0.2 | 0.3 | 0.0 | 0.1 | 0.0 | 0.0 | 0.0 | 0.2 | 0.1 | 0.0 | 0.1 | ||
| 1992 | 0.1 | 0.0 | 0.1 | 0.2 | 0.4 | 0.4 | 0.8 | 0.1 | 0.5 | 0.3 | 0.0 | 0.0 | 0.0 | 0.2 | 0.5 | 0.2 | 0.2 | ||
| 1991 | 0.0 | 0.0 | 0.0 | 0.2 | 0.4 | 0.3 | 1.3 | 1.1 | 0.0 | 0.1 | 0.1 | 0.0 | 0.0 | 0.2 | 0.8 | 0.1 | 0.2 | ||
| 1990 | 0.0 | 0.0 | 0.1 | 0.0 | 0.1 | 0.2 | 0.2 | 0.5 | 0.0 | 1.8 | 0.3 | 0.1 | 0.0 | 0.1 | 0.3 | 0.7 | 0.2 | ||
| 1989 | 0.0 | 0.0 | 0.0 | 0.0 | 0.0 | 0.0 | 0.0 | 0.0 | 0.0 | 0.0 | 0.0 | 0.0 | 0.0 | 0.0 | 0.0 | 0.0 | 0.0 | ||
| 1988 | 0.0 | 0.0 | 0.0 | 0.0 | 0.0 | 0.0 | 0.0 | 0.0 | 0.0 | 0.0 | 0.0 | 0.0 | 0.0 | 0.0 | 0.0 | 0.0 | 0.0 | ||
| 1987 | 0.0 | 0.0 | 0.0 | 0.0 | 0.0 | 0.0 | 0.0 | 0.0 | 0.0 | 0.0 | 0.0 | 0.0 | 0.0 | 0.0 | 0.0 | 0.0 | 0.0 | ||
| 1986 | 0.0 | 0.0 | 0.0 | 0.0 | 0.0 | 0.1 | 0.0 | 0.0 | 0.0 | 0.0 | 0.0 | 0.0 | 0.0 | 0.0 | 0.0 | 0.0 | 0.0 | ||
| 1985 | 0.0 | 0.0 | 0.0 | 0.0 | 0.0 | 0.0 | 0.0 | 0.0 | 0.0 | 0.0 | 0.0 | 0.0 | 0.0 | 0.0 | 0.0 | 0.0 | 0.0 | ||
| 1984 | 0.0 | 0.0 | 0.0 | 0.1 | 0.2 | 0.0 | 0.0 | 0.0 | 0.0 | 0.0 | 0.0 | 0.0 | 0.0 | 0.1 | 0.0 | 0.0 | 0.0 | ||
| 1983 | 0.0 | 0.0 | 0.0 | 0.0 | 0.0 | 0.2 | 0.0 | 0.5 | 0.0 | - | 0.1 | 0.1 | 0.0 | 0.0 | 0.3 | 0.1 | 0.1 | ||
| 1982 | - | 0.0 | - | 0.0 | 0.0 | 0.4 | - | 0.5 | - | 0.5 | - | 0.0 | 0.0 | 0.0 | 0.4 | 0.5 | 0.2 | ||
Reporting rates
Reporting rate is the proportion of all surveys in which the species was present.
Reporting rate by year
This chart shows the reporting rate of Royal Spoonbill each year between 1982 and 2017. 
Reporting rate by month
This chart shows the reporting rate by month of Royal Spoonbill. The blue lines show the reporting rate for the twelve months to June 2017 and the bars show the average reporting rate for the period 1982 to 2017. 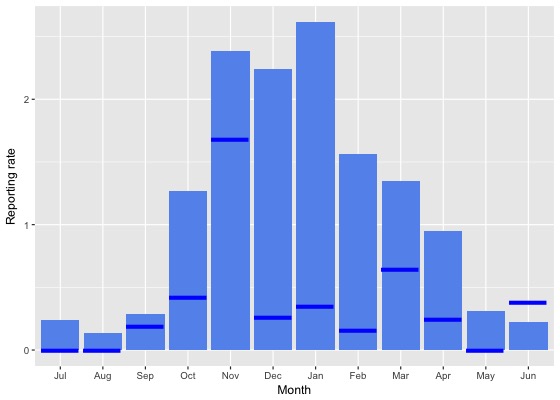
Reporting rate by season
This chart shows the seasonal reporting rate of Royal Spoonbill. The blue lines show the seasonal reporting rate for the twelve months to June 2017 and the bars show the average seasonal reporting rate for the period 1982 to 2017. 
Reporting rate data
| Month | Season | ||||||||||||||||||
|---|---|---|---|---|---|---|---|---|---|---|---|---|---|---|---|---|---|---|---|
| Period | Jul | Aug | Sep | Oct | Nov | Dec | Jan | Feb | Mar | Apr | May | Jun | Winter | Spring | Summer | Autumn | All | ||
| All years | |||||||||||||||||||
| All | 0.2 | 0.1 | 0.3 | 1.3 | 2.4 | 2.2 | 2.6 | 1.6 | 1.3 | 1.0 | 0.3 | 0.2 | 0.2 | 1.3 | 2.2 | 0.9 | 1.2 | ||
| Previous years | |||||||||||||||||||
| All previous years | 0.3 | 0.2 | 0.3 | 1.4 | 2.5 | 2.5 | 3.0 | 1.9 | 1.5 | 1.1 | 0.4 | 0.2 | 0.2 | 1.3 | 2.5 | 1.0 | 1.3 | ||
| Previous 30 years | 0.3 | 0.2 | 0.3 | 1.4 | 2.5 | 2.5 | 3.0 | 1.8 | 1.5 | 1.0 | 0.4 | 0.2 | 0.2 | 1.4 | 2.5 | 1.0 | 1.3 | ||
| Previous 20 years | 0.2 | 0.1 | 0.2 | 1.4 | 2.8 | 2.6 | 3.1 | 1.7 | 1.3 | 0.9 | 0.3 | 0.1 | 0.1 | 1.3 | 2.5 | 0.9 | 1.3 | ||
| 10 year groups | |||||||||||||||||||
| [2007,2017) | 0.3 | 0.1 | 0.2 | 1.4 | 3.0 | 2.3 | 2.3 | 1.2 | 1.1 | 1.0 | 0.4 | 0.1 | 0.2 | 1.4 | 2.0 | 0.9 | 1.2 | ||
| [1997,2007) | 0.1 | 0.1 | 0.1 | 1.1 | 2.4 | 3.1 | 5.8 | 2.9 | 1.5 | 0.5 | 0.0 | 0.1 | 0.1 | 1.1 | 3.8 | 0.8 | 1.5 | ||
| [1987,1997) | 0.5 | 0.3 | 1.0 | 1.6 | 1.7 | 2.3 | 2.7 | 2.6 | 2.8 | 2.0 | 0.7 | 0.7 | 0.5 | 1.5 | 2.5 | 1.9 | 1.6 | ||
| 5 year groups | |||||||||||||||||||
| [2012,2017) | 0.4 | 0.1 | 0.1 | 1.0 | 2.4 | 2.8 | 2.4 | 1.2 | 1.4 | 1.4 | 0.4 | 0.0 | 0.1 | 1.1 | 2.2 | 1.1 | 1.2 | ||
| [2007,2012) | 0.2 | 0.2 | 0.2 | 2.2 | 4.6 | 1.1 | 1.9 | 1.4 | 0.6 | 0.1 | 0.4 | 0.1 | 0.2 | 2.1 | 1.4 | 0.3 | 1.2 | ||
| [2002,2007) | 0.0 | 0.0 | 0.2 | 1.0 | 3.0 | 4.5 | 8.9 | 2.9 | 1.7 | 0.1 | 0.0 | 0.0 | 0.0 | 1.3 | 5.4 | 0.8 | 1.8 | ||
| [1997,2002) | 0.2 | 0.2 | 0.1 | 1.1 | 1.7 | 1.3 | 2.3 | 2.9 | 1.1 | 0.9 | 0.0 | 0.1 | 0.2 | 0.9 | 2.0 | 0.8 | 1.0 | ||
| [1992,1997) | 1.2 | 0.7 | 1.3 | 2.8 | 3.3 | 3.8 | 5.4 | 5.4 | 5.5 | 2.3 | 0.5 | 1.5 | 1.1 | 2.5 | 4.8 | 2.9 | 2.8 | ||
| [1987,1992) | 0.1 | 0.1 | 0.8 | 0.9 | 1.0 | 1.7 | 1.3 | 1.5 | 1.2 | 1.8 | 0.8 | 0.3 | 0.2 | 0.9 | 1.5 | 1.3 | 1.0 | ||
| Year | |||||||||||||||||||
| 2017 | 0.0 | 0.0 | 0.2 | 0.4 | 1.7 | 0.3 | 0.4 | 0.2 | 0.6 | 0.2 | 0.0 | 0.4 | 0.2 | 0.7 | 0.3 | 0.3 | 0.4 | ||
| 2016 | 0.0 | 0.1 | 0.0 | 1.3 | 1.4 | 2.0 | 1.1 | 0.7 | 0.7 | 0.9 | 0.1 | 0.0 | 0.0 | 0.9 | 1.2 | 0.6 | 0.8 | ||
| 2015 | 0.9 | 0.2 | 0.1 | 1.4 | 3.5 | 2.4 | 1.1 | 0.7 | 1.4 | 1.2 | 0.0 | 0.0 | 0.3 | 1.6 | 1.4 | 1.0 | 1.1 | ||
| 2014 | 0.6 | 0.0 | 0.0 | 0.3 | 1.9 | 3.9 | 5.9 | 1.4 | 2.0 | 2.0 | 1.8 | 0.3 | 0.3 | 0.5 | 4.2 | 2.0 | 1.9 | ||
| 2013 | 0.5 | 0.0 | 0.2 | 1.0 | 4.6 | 5.2 | 4.6 | 2.1 | 2.2 | 3.7 | 0.8 | 0.0 | 0.1 | 1.7 | 4.2 | 2.5 | 2.4 | ||
| 2012 | 0.0 | 0.0 | 0.5 | 0.5 | 0.5 | 1.1 | 1.1 | 3.4 | 1.2 | 0.0 | 0.0 | 0.0 | 0.0 | 0.5 | 1.5 | 0.5 | 0.7 | ||
| 2011 | 0.0 | 0.8 | 0.0 | 1.2 | 1.2 | 0.0 | 0.6 | 0.0 | 0.0 | 0.0 | 0.4 | 0.6 | 0.5 | 0.9 | 0.2 | 0.1 | 0.4 | ||
| 2010 | 0.0 | 0.0 | 0.4 | 2.1 | 4.8 | 2.5 | 0.0 | 0.0 | 0.4 | 0.4 | 0.0 | 0.0 | 0.0 | 2.2 | 1.2 | 0.3 | 1.2 | ||
| 2009 | 0.0 | 0.0 | 0.4 | 2.0 | 7.6 | 1.1 | 8.0 | 4.2 | 0.9 | 0.0 | 0.0 | 0.0 | 0.0 | 2.8 | 4.1 | 0.3 | 2.0 | ||
| 2008 | 0.7 | 0.0 | 0.4 | 2.6 | 2.0 | 0.9 | 1.6 | 2.8 | 0.5 | 0.0 | 1.8 | 0.0 | 0.2 | 1.9 | 1.5 | 0.5 | 1.2 | ||
| 2007 | 0.0 | 0.0 | 0.0 | 3.2 | 6.1 | 1.3 | 1.6 | 0.9 | 1.3 | 0.0 | 0.0 | 0.0 | 0.0 | 2.8 | 1.3 | 0.5 | 1.3 | ||
| 2006 | 0.0 | 0.0 | 0.0 | 0.3 | 0.6 | 0.0 | 3.4 | 6.7 | 2.3 | 0.0 | 0.0 | 0.0 | 0.0 | 0.3 | 3.0 | 1.2 | 1.0 | ||
| 2005 | 0.0 | 0.0 | 0.7 | 2.2 | 1.4 | 2.4 | 15.6 | 3.3 | 0.9 | 0.0 | 0.0 | 0.0 | 0.0 | 1.3 | 6.4 | 0.3 | 1.9 | ||
| 2004 | 0.0 | 0.0 | 0.0 | 0.0 | 2.9 | 5.1 | 9.1 | 3.0 | 3.1 | 0.0 | 0.0 | 0.0 | 0.0 | 0.9 | 6.0 | 1.3 | 1.9 | ||
| 2003 | 0.0 | 0.0 | 0.0 | 0.5 | 7.8 | 8.9 | 1.5 | 0.5 | 0.4 | 0.0 | 0.0 | 0.0 | 0.0 | 2.8 | 4.3 | 0.2 | 2.0 | ||
| 2002 | 0.0 | 0.0 | 0.0 | 2.6 | 1.0 | 5.0 | 15.1 | 2.0 | 1.8 | 0.6 | 0.0 | 0.0 | 0.0 | 1.3 | 6.8 | 1.1 | 2.5 | ||
| 2001 | 0.0 | 0.0 | 0.0 | 1.3 | 1.1 | 0.4 | 1.0 | 2.6 | 0.6 | 1.0 | 0.0 | 0.0 | 0.0 | 0.7 | 1.2 | 0.6 | 0.6 | ||
| 2000 | 0.0 | 0.0 | 0.0 | 0.9 | 1.4 | 1.0 | 2.9 | 4.8 | 2.4 | 0.9 | 0.0 | 0.0 | 0.0 | 0.8 | 2.7 | 1.4 | 1.3 | ||
| 1999 | 0.0 | 0.0 | 0.0 | 1.3 | 0.6 | 2.5 | 2.2 | 0.0 | 1.1 | 0.5 | 0.0 | 0.0 | 0.0 | 0.6 | 1.6 | 0.5 | 0.7 | ||
| 1998 | 0.0 | 0.0 | 0.0 | 2.2 | 5.3 | 2.8 | 2.9 | 3.8 | 0.0 | 2.6 | 0.0 | 0.0 | 0.0 | 2.4 | 3.1 | 0.6 | 1.8 | ||
| 1997 | 1.1 | 1.7 | 0.9 | 0.0 | 0.9 | 1.0 | 3.9 | 3.5 | 0.0 | 0.9 | 0.0 | 1.4 | 1.4 | 0.7 | 2.4 | 0.5 | 1.2 | ||
| 1996 | 1.5 | 1.1 | 1.3 | 0.9 | 2.8 | 3.0 | 5.8 | 7.1 | 2.0 | 1.6 | 1.7 | 1.1 | 1.2 | 1.7 | 5.2 | 1.8 | 2.6 | ||
| 1995 | 1.1 | 0.8 | 1.0 | 2.4 | 0.9 | 8.0 | 3.5 | 6.3 | 12.2 | 0.0 | 1.3 | 1.1 | 0.9 | 1.6 | 5.7 | 4.3 | 2.9 | ||
| 1994 | 0.0 | 1.3 | 0.0 | 2.3 | 0.0 | 2.2 | 8.8 | 3.4 | 5.7 | 3.1 | 0.0 | 1.1 | 0.9 | 0.7 | 5.2 | 3.0 | 2.2 | ||
| 1993 | 0.0 | 0.0 | 0.0 | 4.0 | 10.6 | 0.0 | 2.0 | 6.2 | 1.2 | 3.3 | 0.0 | 2.9 | 1.0 | 4.9 | 2.4 | 1.4 | 2.4 | ||
| 1992 | 3.1 | 0.0 | 3.5 | 5.3 | 6.9 | 3.2 | 6.9 | 2.4 | 5.6 | 5.1 | 0.0 | 1.7 | 1.7 | 5.2 | 4.3 | 3.4 | 3.8 | ||
| 1991 | 0.8 | 0.0 | 0.0 | 2.9 | 5.2 | 1.4 | 10.7 | 10.0 | 3.2 | 5.1 | 3.3 | 0.0 | 0.4 | 2.8 | 6.7 | 3.8 | 3.0 | ||
| 1990 | 0.0 | 0.0 | 1.1 | 1.0 | 1.9 | 6.9 | 2.8 | 2.8 | 2.3 | 4.8 | 2.7 | 2.6 | 0.5 | 1.3 | 4.2 | 3.3 | 2.0 | ||
| 1989 | 0.0 | 0.0 | 0.9 | 0.0 | 1.0 | 2.2 | 0.0 | 1.0 | 1.1 | 0.5 | 0.0 | 0.0 | 0.0 | 0.6 | 1.1 | 0.6 | 0.6 | ||
| 1988 | 0.0 | 0.4 | 0.6 | 0.4 | 0.0 | 0.5 | 0.0 | 1.1 | 0.5 | 3.2 | 0.5 | 0.0 | 0.1 | 0.3 | 0.5 | 1.4 | 0.5 | ||
| 1987 | 0.0 | 0.0 | 1.2 | 1.6 | 0.3 | 0.5 | 0.5 | 0.0 | 1.0 | 0.0 | 0.4 | 0.0 | 0.0 | 1.0 | 0.3 | 0.4 | 0.5 | ||
| 1986 | 0.0 | 0.0 | 1.9 | 0.0 | 0.0 | 5.9 | 4.3 | 0.0 | 0.0 | 0.0 | 0.0 | 0.0 | 0.0 | 0.7 | 3.2 | 0.0 | 0.9 | ||
| 1985 | 0.0 | 0.0 | 0.0 | 0.0 | 0.0 | 0.0 | 0.0 | 0.0 | 0.0 | 5.3 | 0.0 | 0.0 | 0.0 | 0.0 | 0.0 | 2.5 | 0.2 | ||
| 1984 | 0.0 | 0.0 | 0.0 | 8.3 | 25.0 | 0.0 | 0.0 | 3.0 | 0.0 | 0.0 | 0.0 | 0.0 | 0.0 | 9.5 | 1.4 | 0.0 | 1.3 | ||
| 1983 | 0.0 | 0.0 | 0.0 | 0.0 | 0.0 | 7.7 | 0.0 | 9.1 | 0.0 | - | 8.3 | 9.1 | 3.4 | 0.0 | 6.7 | 7.1 | 4.0 | ||
| 1982 | - | 0.0 | - | 0.0 | 0.0 | 14.3 | - | 9.1 | - | 15.4 | - | 0.0 | 0.0 | 0.0 | 12.0 | 15.4 | 6.9 | ||
Breeding data
Breeding records by month
Number of breeding records by breeding code and month, 2017 and all years| Breeding code | Jul | Aug | Sep | Oct | Nov | Dec | Jan | Feb | Mar | Apr | May | Jun |
|---|---|---|---|---|---|---|---|---|---|---|---|---|
| 2017 | ||||||||||||
| Breeding (BLA code) | 0 | 0 | 0 | 0 | 0 | 0 | 0 | 0 | 0 | 0 | 0 | 0 |
| Carrying Food | 0 | 0 | 0 | 0 | 0 | 0 | 0 | 0 | 0 | 0 | 0 | 0 |
| Copulating | 0 | 0 | 0 | 0 | 0 | 0 | 0 | 0 | 0 | 0 | 0 | 0 |
| Display | 0 | 0 | 0 | 0 | 0 | 0 | 0 | 0 | 0 | 0 | 0 | 0 |
| Dependent young | 0 | 0 | 0 | 0 | 0 | 0 | 0 | 0 | 0 | 0 | 0 | 0 |
| Faecal sac | 0 | 0 | 0 | 0 | 0 | 0 | 0 | 0 | 0 | 0 | 0 | 0 |
| Inspecting hollow | 0 | 0 | 0 | 0 | 0 | 0 | 0 | 0 | 0 | 0 | 0 | 0 |
| Nest building | 0 | 0 | 0 | 0 | 0 | 0 | 0 | 0 | 0 | 0 | 0 | 0 |
| Nest with eggs | 0 | 0 | 0 | 0 | 0 | 0 | 0 | 0 | 0 | 0 | 0 | 0 |
| Nest with young | 0 | 0 | 0 | 0 | 0 | 0 | 0 | 0 | 0 | 0 | 0 | 0 |
| On/leaving nest | 0 | 0 | 0 | 0 | 0 | 0 | 0 | 0 | 0 | 0 | 0 | 0 |
| All years | ||||||||||||
| Breeding (BLA code) | 0 | 0 | 0 | 1 | 7 | 2 | 2 | 0 | 0 | 0 | 0 | 0 |
| Carrying Food | 0 | 0 | 0 | 0 | 0 | 0 | 0 | 0 | 0 | 0 | 0 | 0 |
| Copulating | 0 | 0 | 0 | 0 | 1 | 0 | 0 | 0 | 0 | 0 | 0 | 0 |
| Display | 0 | 0 | 0 | 1 | 0 | 0 | 0 | 0 | 0 | 0 | 0 | 0 |
| Dependent young | 0 | 0 | 0 | 0 | 0 | 0 | 3 | 2 | 0 | 0 | 0 | 0 |
| Faecal sac | 0 | 0 | 0 | 0 | 0 | 0 | 0 | 0 | 0 | 0 | 0 | 0 |
| Inspecting hollow | 0 | 0 | 0 | 0 | 0 | 0 | 0 | 0 | 0 | 0 | 0 | 0 |
| Nest building | 0 | 0 | 0 | 1 | 3 | 0 | 0 | 0 | 0 | 0 | 0 | 0 |
| Nest with eggs | 0 | 0 | 0 | 0 | 0 | 0 | 0 | 0 | 0 | 0 | 0 | 0 |
| Nest with young | 0 | 0 | 0 | 0 | 0 | 1 | 1 | 1 | 0 | 0 | 0 | 0 |
| On/leaving nest | 0 | 0 | 0 | 1 | 4 | 2 | 0 | 0 | 0 | 0 | 0 | 0 |
Breeding records by year
Average number of breeding records per period by breeding code| Period | Breeding (BLA code) | Carrying Food | Copulating | Display | Dependent young | Faecal sac | Inspecting hollow | Nest building | Nest with eggs | Nest with young | On/leaving nest |
|---|---|---|---|---|---|---|---|---|---|---|---|
| All years | |||||||||||
| All | 0.3 | 0.0 | 0.0 | 0.0 | 0.1 | 0.0 | 0.0 | 0.1 | 0.0 | 0.1 | 0.2 |
| Previous years | |||||||||||
| All previous years | 0.3 | 0.0 | 0.0 | 0.0 | 0.1 | 0.0 | 0.0 | 0.1 | 0.0 | 0.1 | 0.2 |
| Previous 30 years | 0.4 | 0.0 | 0.0 | 0.0 | 0.2 | 0.0 | 0.0 | 0.1 | 0.0 | 0.1 | 0.2 |
| Previous 20 years | 0.6 | 0.0 | 0.0 | 0.0 | 0.2 | 0.0 | 0.0 | 0.2 | 0.0 | 0.1 | 0.3 |
| 10 year groups | |||||||||||
| [2007,2017) | 1.0 | 0.0 | 0.1 | 0.1 | 0.3 | 0.0 | 0.0 | 0.4 | 0.0 | 0.2 | 0.7 |
| [1997,2007) | 0.2 | 0.0 | 0.0 | 0.0 | 0.2 | 0.0 | 0.0 | 0.0 | 0.0 | 0.1 | 0.0 |
| [1987,1997) | 0.0 | 0.0 | 0.0 | 0.0 | 0.0 | 0.0 | 0.0 | 0.0 | 0.0 | 0.0 | 0.0 |
| 5 year groups | |||||||||||
| [2012,2017) | 0.0 | 0.0 | 0.0 | 0.0 | 0.0 | 0.0 | 0.0 | 0.0 | 0.0 | 0.0 | 0.0 |
| [2007,2012) | 2.0 | 0.0 | 0.2 | 0.2 | 0.6 | 0.0 | 0.0 | 0.8 | 0.0 | 0.4 | 1.4 |
| [2002,2007) | 0.0 | 0.0 | 0.0 | 0.0 | 0.0 | 0.0 | 0.0 | 0.0 | 0.0 | 0.0 | 0.0 |
| [1997,2002) | 0.4 | 0.0 | 0.0 | 0.0 | 0.4 | 0.0 | 0.0 | 0.0 | 0.0 | 0.2 | 0.0 |
| [1992,1997) | 0.0 | 0.0 | 0.0 | 0.0 | 0.0 | 0.0 | 0.0 | 0.0 | 0.0 | 0.0 | 0.0 |
| [1987,1992) | 0.0 | 0.0 | 0.0 | 0.0 | 0.0 | 0.0 | 0.0 | 0.0 | 0.0 | 0.0 | 0.0 |
| Year | |||||||||||
| 2017 | 0.0 | 0.0 | 0.0 | 0.0 | 0.0 | 0.0 | 0.0 | 0.0 | 0.0 | 0.0 | 0.0 |
| 2016 | 0.0 | 0.0 | 0.0 | 0.0 | 0.0 | 0.0 | 0.0 | 0.0 | 0.0 | 0.0 | 0.0 |
| 2015 | 0.0 | 0.0 | 0.0 | 0.0 | 0.0 | 0.0 | 0.0 | 0.0 | 0.0 | 0.0 | 0.0 |
| 2014 | 0.0 | 0.0 | 0.0 | 0.0 | 0.0 | 0.0 | 0.0 | 0.0 | 0.0 | 0.0 | 0.0 |
| 2013 | 0.0 | 0.0 | 0.0 | 0.0 | 0.0 | 0.0 | 0.0 | 0.0 | 0.0 | 0.0 | 0.0 |
| 2012 | 0.0 | 0.0 | 0.0 | 0.0 | 0.0 | 0.0 | 0.0 | 0.0 | 0.0 | 0.0 | 0.0 |
| 2011 | 0.0 | 0.0 | 0.0 | 0.0 | 0.0 | 0.0 | 0.0 | 0.0 | 0.0 | 0.0 | 0.0 |
| 2010 | 1.0 | 0.0 | 1.0 | 0.0 | 0.0 | 0.0 | 0.0 | 0.0 | 0.0 | 0.0 | 3.0 |
| 2009 | 9.0 | 0.0 | 0.0 | 1.0 | 3.0 | 0.0 | 0.0 | 4.0 | 0.0 | 2.0 | 4.0 |
| 2008 | 0.0 | 0.0 | 0.0 | 0.0 | 0.0 | 0.0 | 0.0 | 0.0 | 0.0 | 0.0 | 0.0 |
| 2007 | 0.0 | 0.0 | 0.0 | 0.0 | 0.0 | 0.0 | 0.0 | 0.0 | 0.0 | 0.0 | 0.0 |
| 2006 | 0.0 | 0.0 | 0.0 | 0.0 | 0.0 | 0.0 | 0.0 | 0.0 | 0.0 | 0.0 | 0.0 |
| 2005 | 0.0 | 0.0 | 0.0 | 0.0 | 0.0 | 0.0 | 0.0 | 0.0 | 0.0 | 0.0 | 0.0 |
| 2004 | 0.0 | 0.0 | 0.0 | 0.0 | 0.0 | 0.0 | 0.0 | 0.0 | 0.0 | 0.0 | 0.0 |
| 2003 | 0.0 | 0.0 | 0.0 | 0.0 | 0.0 | 0.0 | 0.0 | 0.0 | 0.0 | 0.0 | 0.0 |
| 2002 | 0.0 | 0.0 | 0.0 | 0.0 | 0.0 | 0.0 | 0.0 | 0.0 | 0.0 | 0.0 | 0.0 |
| 2001 | 0.0 | 0.0 | 0.0 | 0.0 | 0.0 | 0.0 | 0.0 | 0.0 | 0.0 | 0.0 | 0.0 |
| 2000 | 2.0 | 0.0 | 0.0 | 0.0 | 0.0 | 0.0 | 0.0 | 0.0 | 0.0 | 0.0 | 0.0 |
| 1999 | 0.0 | 0.0 | 0.0 | 0.0 | 1.0 | 0.0 | 0.0 | 0.0 | 0.0 | 0.0 | 0.0 |
| 1998 | 0.0 | 0.0 | 0.0 | 0.0 | 1.0 | 0.0 | 0.0 | 0.0 | 0.0 | 1.0 | 0.0 |
| 1997 | 0.0 | 0.0 | 0.0 | 0.0 | 0.0 | 0.0 | 0.0 | 0.0 | 0.0 | 0.0 | 0.0 |
| 1996 | 0.0 | 0.0 | 0.0 | 0.0 | 0.0 | 0.0 | 0.0 | 0.0 | 0.0 | 0.0 | 0.0 |
| 1995 | 0.0 | 0.0 | 0.0 | 0.0 | 0.0 | 0.0 | 0.0 | 0.0 | 0.0 | 0.0 | 0.0 |
| 1994 | 0.0 | 0.0 | 0.0 | 0.0 | 0.0 | 0.0 | 0.0 | 0.0 | 0.0 | 0.0 | 0.0 |
| 1993 | 0.0 | 0.0 | 0.0 | 0.0 | 0.0 | 0.0 | 0.0 | 0.0 | 0.0 | 0.0 | 0.0 |
| 1992 | 0.0 | 0.0 | 0.0 | 0.0 | 0.0 | 0.0 | 0.0 | 0.0 | 0.0 | 0.0 | 0.0 |
| 1991 | 0.0 | 0.0 | 0.0 | 0.0 | 0.0 | 0.0 | 0.0 | 0.0 | 0.0 | 0.0 | 0.0 |
| 1990 | 0.0 | 0.0 | 0.0 | 0.0 | 0.0 | 0.0 | 0.0 | 0.0 | 0.0 | 0.0 | 0.0 |
| 1989 | 0.0 | 0.0 | 0.0 | 0.0 | 0.0 | 0.0 | 0.0 | 0.0 | 0.0 | 0.0 | 0.0 |
| 1988 | 0.0 | 0.0 | 0.0 | 0.0 | 0.0 | 0.0 | 0.0 | 0.0 | 0.0 | 0.0 | 0.0 |
| 1987 | 0.0 | 0.0 | 0.0 | 0.0 | 0.0 | 0.0 | 0.0 | 0.0 | 0.0 | 0.0 | 0.0 |
| 1986 | 0.0 | 0.0 | 0.0 | 0.0 | 0.0 | 0.0 | 0.0 | 0.0 | 0.0 | 0.0 | 0.0 |
| 1985 | 0.0 | 0.0 | 0.0 | 0.0 | 0.0 | 0.0 | 0.0 | 0.0 | 0.0 | 0.0 | 0.0 |
| 1984 | 0.0 | 0.0 | 0.0 | 0.0 | 0.0 | 0.0 | 0.0 | 0.0 | 0.0 | 0.0 | 0.0 |
| 1983 | 0.0 | 0.0 | 0.0 | 0.0 | 0.0 | 0.0 | 0.0 | 0.0 | 0.0 | 0.0 | 0.0 |
| 1982 | 0.0 | 0.0 | 0.0 | 0.0 | 0.0 | 0.0 | 0.0 | 0.0 | 0.0 | 0.0 | 0.0 |
Distribution map
Distribution - 2017
This map shows the observed distribution of the Royal Spoonbill for 2017.
The red circles are the grid cells where Royal Spoonbill have been reported.
The transparency of the red circles indicate how many surveys sheets were submitted for that grid cell; the darker the red the more reliable the data. Of the 315 grid cells with reports, 83 had only one sheet; an example is grid number A11.
The size of the circle represents the reporting rate. The maximum reporting rate for Royal Spoonbill was 10.5% (eg grid number U3) and the minimum was 0.4% (eg grid number L11). 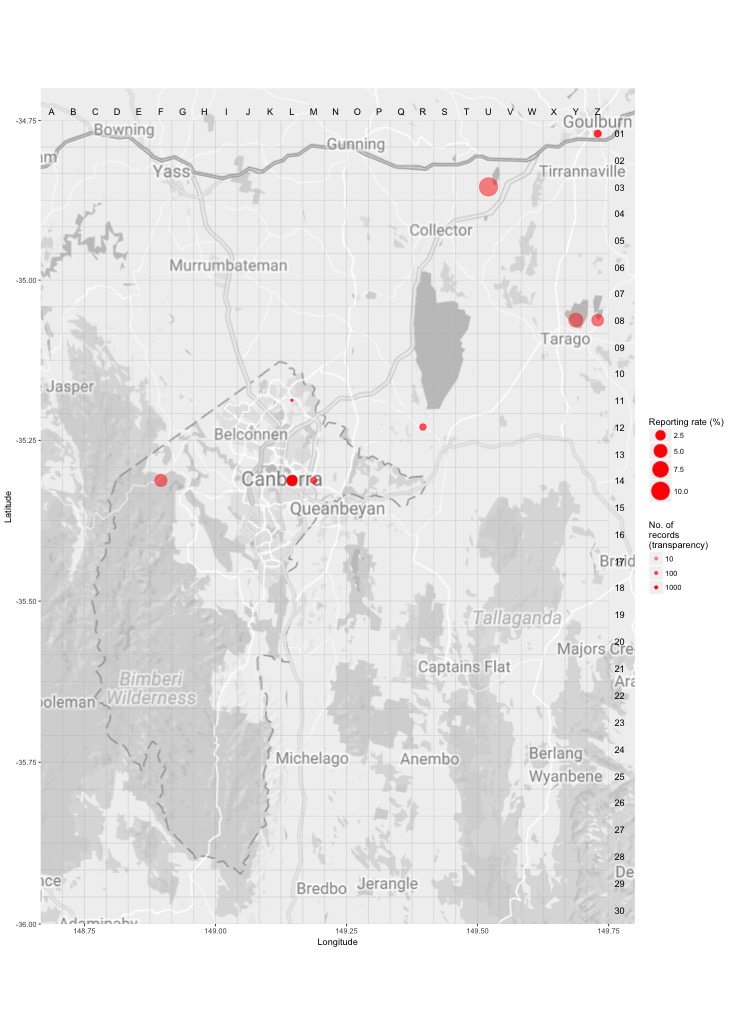
Distribution - all years
This map shows the observed distribution of the Royal Spoonbill for all years.
The red circles are the grid cells where Royal Spoonbill have been reported.
The transparency of the red circles indicate how many surveys sheets were submitted for that grid cell; the darker the red the more reliable the data. Of the 703 grid cells with reports, 55 had only one sheet; an example is grid number A12.
The size of the circle represents the reporting rate. The maximum reporting rate for Royal Spoonbill was 34.2% (eg grid number R6) and the minimum was 0.0% (eg grid number L13). 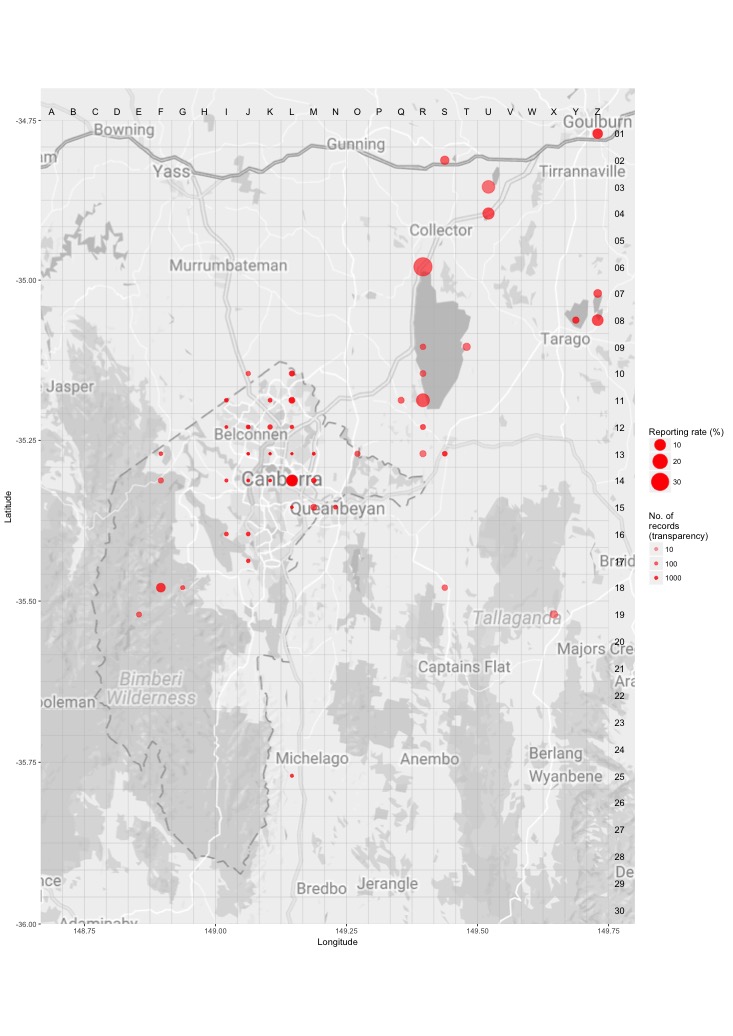
Breeding map
Breeding - 2017
This map shows the breeding distribution of the Royal Spoonbill for 2017.
The red circles are the grid cells where breeding activity for Royal Spoonbill have been reported.
The size of the circle represents the number of reports. 
Breeding - all years
This map shows the breeding distribution of the Royal Spoonbill for all years.
The red circles are the grid cells where breeding activity for Royal Spoonbill have been reported.
The size of the circle represents the number of reports. 